Table of contents

A good page load time is one that provides users with a sense of speed and fluidity, reducing abandonment. Google recommends that the largest content (Largest Contentful Paint, LCP) should load within 2.5 seconds of the page starting to load, according to current Core Web Vitals guidelines. This threshold has been considered a „good” result – with such a time, most users do not experience lag. However, it’s not just about speed – visual stability, time to interact, and smoothness of the entire site are equally important.
What is optimal page load time?
Optimal page load time balances the needs of UX, SEO, and conversion, while taking into account the technical limitations of the site and user expectations. There is tremendous value in a site that responds almost instantly to user actions, minimizing any perceived delays. In practice, this means that the main content of the site should appear almost immediately after clicking or typing in the address (on the order of a fraction of a second), and the full functionality of the site should be available in about 1-2 seconds.
What should be the page load time in seconds?
The Google Core Web Vitals guidelines define as a target ≤ 2.5 seconds for LCP and < 200 ms for INP (a measure of responsiveness) as the limits of a good user experience. Obviously, the shorter the time, the better – aiming for sub-second values maximizes user perception of the site.
source: https://web.dev/articles/vitals?hl=pl#core-web-vitals
Global research shows that the average wait time for a full page to load is about 3.2 seconds on mobile devices and 2.8 seconds on desktops. From an SEO and user experience perspective, however, it makes sense to aim for values clearly below these averages, especially since Google is placing a strong emphasis on mobile optimization and page load speed in 2025.
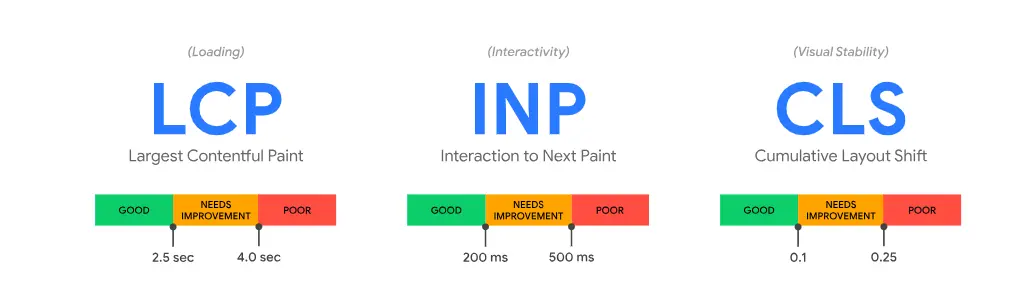
Core Web Vitals metrics such as:
- Largest Contentful Paint (LCP) less than 2.5 seconds
- Interaction to Next Paint (INP) less than 200 ms
- Cumulative Layout Shift (CLS) less than 0.1
are now standards that directly impact ranking in search results and user satisfaction. Meeting these thresholds helps reduce rejection rates and improve conversions, which is especially important in the context of rising mobile traffic, which now accounts for more than 62% of all Internet traffic.

source: https://www-mobiloud-com./blog/what-percentage-of-internet-traffic-is-mobile
What are the most important website performance metrics?
The most important website performance metrics are still Core Web Vitals, which Google uses to evaluate the quality of user experience and position in search results. They consist of:
- LCP (Largest Contentful Paint) – the loading time of the largest visible element, ideally under 2.5 seconds
- INP (Interaction to Next Paint) – a new metric that replaces FID, measuring the responsiveness of a site during user interaction,
- CLS (Cumulative Layout Shift) – an indicator of a site’s visual stability
The FID (First Input Delay) metric, which previously measured the latency of the first interaction, has been replaced in 2024 by the more comprehensive and accurate INP metric, better capturing the actual user experience when interacting with a site.
In addition to Core Web Vitals, metrics such as Time to Interactive (TTI), First Contentful Paint (FCP) and overall page load time are also still monitored, as well as business metrics like rejection rates and conversions.
What affects page load time the most?
Page load time is most affected by the speed of the server response and the way resources are delivered to the browser. Data from actual visits show that the most significant metric affecting LCP is time to first byte (TTFB) – the slower the server response, the later the rendering of the main content begins. Also important are delays due to blocking resources such as CSS or JavaScript, which can hold up the start of loading visible page elements.
The most common factors slowing down loading are:
lack of lazy loading – loading all images and multimedia at once, instead of as you scroll, increases the initial load on the page
heavy multimedia resources – non-optimized high-resolution images and videos significantly increase download times. It is advisable to use modern formats (WebP, AVIF), compression and declare dimensions (width/height) to avoid layout shifts (CLS)
blocking scripts and styles – CSS/JS files loaded synchronously in <head> hold up rendering. It is recommended to minimize them, delay their loading or split them into fragments (code splitting)
external (third-party) resources – ads, widgets and other scripts from outside the domain can cause delays and layout instability. Where possible, they should be loaded asynchronously or after the main content is loaded
fonts and dynamic content – no font-display declaration: swap results in delayed text display, and dynamic elements (chatbots, notifications) can block page interactivity
expanded DOM tree – an excess of elements in the HTML structure overloads the browser, increasing rendering time and degrading the user experience
non-optimal hosting or lack of CDN – TTFB exceeding 500 ms indicates server-side problems. In such cases, it is worthwhile to implement caching and consider a content delivery network (CDN)
How does loading time vary on different devices in seconds?
Average loading times clearly vary between device types. The Illustrate Digital report states that average page load time is about 3.2 seconds on smartphones and 2.8 seconds on computers. The difference is due to the lower computing power of mobile devices and often slower or less stable internet connections.

source: https://illustrate.digital/reports/global-page-speed-2023/#global-results
When designing, keep in mind that mobile and desktop performance can differ significantly, so it’s a good idea to test your site on different devices and browsers to ensure optimal performance under all conditions.
Why page load time is important for a website?
Page load speed directly affects sales, search engine visibility and user satisfaction. A fast site increases visitor engagement, shortens the conversion path and reduces the abandonment rate. Google has confirmed that Core Web Vitals scores are factored into search rankings – sites performing well in LCP, INP and CLS are more likely to rank higher in the SERP. Efficiently performing sites also attract more frequent visits from indexing bots.
Poor performance results in turn in higher rejection rates and lower conversions, resulting in lower revenue. Too slow loading:
- increases bounce rate
- decreases session duration
- lowers conversion rate
- deteriorates CWV ratings, which negatively affects SEO
How does slow loading affect user behavior?
Slow loading leads to frustration – users not only leave the site, but also return less often. According to Think with Google, when a page takes up to five seconds to load, the likelihood of abandonment increases by as much as 90%.

https://www.thinkwithgoogle.com/marketing-strategies/app-and-mobile/mobile-bounce-rate-statistics/
Users don’t wonder why something is running slow – they just give up.
How to measure page load time?
Page load time can be measured both in a lab setting and from real user data. To measure performance, there are tools such as PageSpeed Insights, GTmetrix or Lighthouse, which differ in the scope of data, the way they work and their usefulness in different scenarios. Below is a brief comparison of them:
- Type: online tool from Google
- Data: lab (Lighthouse) + real (CrUX)
- Scope: LCP, INP, CLS, FCP, SI and others
- Values: combines synthetic and real data, user-friendly interface
- Disadvantages: limited test personalization (e.g. no location selection)presents Chrome UX Report (CrUX) data and synthetic test results, offering detailed optimization recommendations.
- Type: web-based platform
- Data: configurable lab (location, device, throttling)
- Scope: detailed graphs (e.g. waterfall), LCP, TBT, SI analysis
- Values: visual charging analysis, precise test settings
- Disadvantages: no CrUX data; some features require Pro account
- Type: developer tool in Chrome / plugin
- Data: lab only (synthetic)
- Scope: performance, SEO, accessibility, PWA, best practices
- Benefits: quick local audit, detailed guidance, ability to test working versions (e.g. locally)
- Disadvantages: lack of data from actual users
Measurements should be performed regularly, both in synthetic (lab) and real-world (field data) environments. It is important to study not only overall loading time, but specific metrics that are relevant to UX and SEO.
Which tools will work best for measurement?
The choice of tool depends on the purpose of the analysis. Below is a summary to help you choose the right one:
- PageSpeed Insights – for a quick overview of a site’s health on mobile and desktop devices, including actual (CrUX) and synthetic (Lighthouse) data,
- GTmetrix – for technical analysis of page loading, with waterfall graphs, the ability to change test locations and network conditions,
- Lighthouse – for local performance, SEO and accessibility audits, an ideal tool for developers testing changes before release,
- Google Search Console (Core Web Vitals) – for evaluating actual UX based on CrUX data, showing how a site performs for real users,
The Core Web Vitals report in Google Search Console presents Chrome UX Report (CrUX) data for all monitored sub-sites, showing which ones meet the requirements for LCP, INP and CLS. This allows you to combine lab analysis (e.g. FCP, Speed Index) with real user experience.
On the other hand, if you have access to the SEMSTORM tool, it’s worth using it to conduct an automated PageSpeed audit for your entire site structure. After importing a sitemap, the tool analyzes each subpage based on Lighthouse data and presents the results in the form of clear reports. The data can be filtered by mobile or desktop version, as well as specific metrics, which significantly improves the planning of optimization efforts.
All the tools listed measure parameters affecting performance and UX:
- Total Blocking Time (TBT) – the time interactions are blocked by JS and other resources.
- First Contentful Paint (FCP) – time until the first page element appears,
- Largest Contentful Paint (LCP) – time until the main content loads,
- Time to First Byte (TTFB) – server response time,
- Cumulative Layout Shift (CLS) – visual stability of elements during loading,
What impact does loading time have on SEO and conversion?
Page loading time directly affects a page’s position in search results and business results. Google has confirmed that Core Web Vitals have been factored into its ranking algorithms – sites with good LCP, INP and CLS scores may be preferred by the search engine. For site owners, this means that site speed is now an important part of their SEO strategy. Slow loading times, on the other hand, negatively affect visitor behavior, resulting in lower revenue and poorer conversion rates.
How do Core Web Vitals affect SEO?
Core Web Vitals is a set of metrics that assess a site’s speed and stability. Google recommends getting good scores on Core Web Vitals to „achieve search engine success.” This means that sites meeting the designated thresholds (LCP ≤ 2.5 s, INP < 200 ms, CLS < 0.1) can gain a ranking advantage over slower sites. In practice, however, CWVs are one of many SEO factors – content quality or domain popularity are also important. Nevertheless, achieving good scores in Core Web Vitals positively affects the overall „Page Experience” and can improve a site’s visibility.
What to do when a page loads too slowly?
The most effective way to speed up page loading is through comprehensive optimization including graphics compression, code optimization and proper cache utilization.
- graphics optimization: downsize, convert to WebP and implement lazy loading,
- code optimization: minify HTML, CSS and JavaScript files and merge them,
- server configuration: efficient hosting, up-to-date PHP and CDN implementation,
- cache memory: browser-side and server-side caching,
- reduction of HTTP requests: combining CSS/JavaScript files and using CSS Sprites,
- plugin management: removing the unnecessary and optimizing the necessary,
- external scripts: implementing asynchronous loading and deferring the download of non-critical elements.
Systematic monitoring of site performance, including speed testing, Core Web Vitals and server response time analysis, allows you to quickly detect and resolve potential performance issues.
Which page elements slow down loading the most?
The biggest contributors to slow page loading are suboptimal images, external scripts and excess plugins in CMS systems.The most common bottlenecks are:
- Large media files: high quality images and videos (especially uncompressed). Optimizing them (size and format) and using lazy-loading improves loading results.
- External scripts and advertisements: libraries downloaded from CDNs and advertising scripts can block loading. It’s often a good idea to load them only after the main content is loaded or to minimize the number of requests.
- Render-blocking CSS/JS: any CSS or JS file on top of the page hinders faster rendering. Minification and moving scripts to the bottom or using async/defer significantly speeds up the initial load.
- Web fonts: if you don’t use font-display: swap and preload, the browser may delay displaying text until the font is downloaded. Ensure priority loading of major fonts so that text appears immediately.
- Lack of element dimensions: inserting elements (e.g., ads, iframes) without specific dimensions causes layout „jumps”. While this is mainly a CLS problem, it also causes a delay in the final display of the full page view.
What are the most effective methods for optimizing page load time?
The most effective methods for optimizing page load time are image compression, code optimization and cache utilization.
- image compression: adjusting sizes to actual needs and implementing lazy loading,
- code optimization: removing unnecessary characters from HTML, CSS and JavaScript files and combining files of the same type,
- cache memory: caching in the browser and configuring cache headers.
Efficient use of the server by upgrading PHP to the latest version and enabling GZIP compression also plays a significant role. The implementation of a CDN will help distribute content over a network of servers, significantly reducing loading times for users from different locations.
- limit the number of HTTP requests through CSS Sprites for icons,
- asynchronous loading of JavaScript,
- optimize fonts through local hosting,
- regularly clean the database,
- remove unused plugins.
At the server level, it is important to choose the right hosting and optimize Apache or Nginx settings. Regular performance monitoring allows you to quickly detect and resolve potential problems with page loading speed.
Was the article helpful?
Rate our article, it means a lot to us!
Let's talk!

Specjalistka SEO z 6-letnim doświadczeniem w branży digital marketingu. Łączy analityczne podejście z kreatywnością, tworząc strategie SEO, które realnie wspierają rozwój biznesu. Specjalizuje się w technicznym SEO oraz budowaniu strategii contentowych. W pracy ceni testowanie nieszablonowych rozwiązań, które pomagają jej patrzeć na SEO z różnych perspektyw. Prywatnie miłośniczka kuchni roślinnej i dźwięków, które wykraczają poza mainstream.