Table of contents
Churn rate – what is it and how does it affect your business? If you’re losing customers faster than you’re gaining new ones, you have a problem that could cost you thousands a year. How do you calculate churn rate and apply strategies to reduce it? The key lies in analyzing the causes, optimizing your offerings and effectively retaining customers. Learn proven methods that have helped major brands reduce user churn and increase user loyalty. Learn what actions realistically reduce churn rate and how to put them into practice in your business.

What is churn rate and why is it important for your business?
Churn rate – what does it actually mean and why does it matter for your business? In the simplest terms, it is an indicator that shows how many customers abandon your services over a certain period of time. It is essential to analyze it, especially for subscription businesses, e-commerce or mobile apps – it allows you to understand whether users remain loyal or drift away to competitors. If the churn rate is rising, your costs of acquiring new customers may no longer be recouped, and the business will become less profitable.
Can you effectively reduce the churn rate? Yes, but it requires analysis and actions tailored to your business. Find out why customers are leaving – is it a problem with price, service, or perhaps product quality? Then think about implementing:
- improved communication – regular satisfaction surveys and quick responses to problems,
- loyalty system – rewards for regular customers can improve retention,
- proactive support – personalized messaging and onboarding help retain users.
Reducing churn rate comes down to one thing: delivering enough value that the customer doesn’t even think about leaving.
Also, this indicator plays a role in forecasting future revenue and assessing a company’s financial health. In industries such as telecommunications or digital services, where competition is particularly fierce, low churn rates can be critical in maintaining market position. By analyzing the reasons for churn, companies can make important changes to their strategy, such as:
- improve service standards,
- introduce loyalty programs.
What are the types of churn rate?
Chrun rate can be divided into several categories, depending on why customers churn. The most important are two types: voluntary and involuntary.
Voluntary churn is when customers consciously decide to leave. Why?” There can be many reasons:
- they don’t see the value in your offering – the product doesn’t meet their expectations or they no longer need it,
- the competition tempts with better terms – lower price, better service, broader functionality,
- their needs change – what was ideal a year ago may be unnecessary today.
What to do about it? Personalize the offer, listen to customer feedback and show why it’s worth staying. Sometimes a small change in communication can reverse the decision to leave.
Involuntary churn is a different story. This is where customers do not want to leave, but lose access to the service through factors beyond their control. The most common cases?
- payment problems – expired card, lack of funds in the account,
- technical errors – system crashes, overly complicated login process,
- withchanges in terms and conditions – if the conditions of use suddenly deteriorate, some users will churn.
Such churn can be mitigated -payment reminders, simple access recovery processes and flexible subscription options can significantly reduce customer churn.
There is also revenue churn (MRR Churn Rate), which shows how much a company loses from churn, and numerical churn, which measures the sheer number of departing customers. Both metrics give a more complete picture and help you decide what strategies to reduce churn rate will be most effective.

How to calculate churn rate?
Churn rate – or customer loss rate – can be calculated easily. Just use this formula:
Churn Rate = (Number of customers lost / Number of customers at the beginning of the period) × 100
Example? If a company had 1000 customers at the beginning of the month and at the end there were 950 left, the churn rate is (50 / 1000) × 100 = 5%.

What affects the accuracy of the calculation?
- quality of data – it matters to accurately track both new and departing customers,
- type of churn – voluntary churn (customer churn) and involuntary churn (e.g. payment problem) are worth analyzing separately,
- method of counting – if the customer base is changing dynamically, it is better to consider the average number of customers in a given period instead of the initial value.
Why is it worth monitoring churn rate regularly? Because it is the best way to:
- catch trends – for example. whether customer churn is increasing or decreasing,
- checking whether retention strategies are working,
- improving financial planning – e.g., by analyzing the MRR Churn Rate, i.e., the impact of churn on revenue.
Not every industry analyzes churn in the same way. In B2B, it is more common to use cohort analysis, or tracking churn of customers from a specific group (e.g., those who joined at the same time). This helps to better match the strategy to real needs.
What mistakes do we make when calculating churn rate?
Calculating churn rate seems simple, but it’s easy to make mistakes that can lead to bad decisions. The most common of these are:
- Incorrect customer counting – we only take active customers from the beginning of the period into the calculation. If we include, for example, those who came during, the result will be skewed,
- lack of segmentation – churn rate of new customers and those who have been with the company for years are two completely different cases. It’s worth analyzing them separately.
- outdated data – the customer base is changing, so it’s worth updating statistics regularly,
- overlooking involuntary churn – if customers lose access to a service by accident (such as a failed payment), it doesn’t necessarily mean they actually want to leave. You can get them back,
- confusing churn rate with other metrics – for example, customer retention tells you how many users stay, while churn shows how many leave. These are similar concepts, but not the same,
- lack of consideration of seasonality – in some industries, churn increases after the holidays or during the holiday season, for example. If we forget this, we can draw the wrong conclusions.
How to avoid these mistakes? Good analytical tools, frequent updating of data and regular testing of different churn counting methods. This allows you to better understand what is actually happening with your customers.
Where to get data to calculate churn rate?
Don’t have good data? You don’t have a reliable churn rate. It’s a simple relationship, but many companies ignore it. The most important source? Your own customer base. It’s worth starting by analyzing CRM systems, subscription platforms and transaction history. That’s where you’ll find concrete numbers: how many customers there were at the start, how many have left, and how their activity has changed. What else to use?
- data from billing systems – ideal if you have a subscription model. Non-payment often means cancellation, but it’s worth checking to see if it’s an actual customer decision or, for example, a card error,
- user logs – analyzing activity in the app or on the site will show you who has stopped using the service before they’ve even officially opted out. You can catch patterns of declining engagement and act before churn becomes a reality,
- customer surveys and feedback – may seem trivial, but are a valuable source of insight. Sometimes users give reasons for leaving directly, and this allows you to tailor strategies to reduce churn rate.
If you want to know how to calculate churn rate, you first need to know exactly what you are counting. Companies make the mistake of treating all customers the same. Meanwhile, it’s a good idea to segment the base: new vs. long-term, customers with large transactions vs. occasional. Churn in each of these groups has different causes.
Automation is key. You can, of course, analyze the data manually, but sooner or later you will find that this is not feasible. It’s worth implementing analytical tools to help monitor churn rate in real time. Platforms such as Mixpanel, Google Analytics 4 or Looker Studio allow you to combine data from different sources and draw specific conclusions.
Remember: churn rate and customer retention are two related but different metrics. By measuring retention, you focus on how many customers stay. When you count churn rate, you analyze those who leave. To reduce churn rate effectively, you need both hard data and knowledge of why customers are churning. Only then can you implement strategies that actually work.
What are the churn rate standards in different industries?
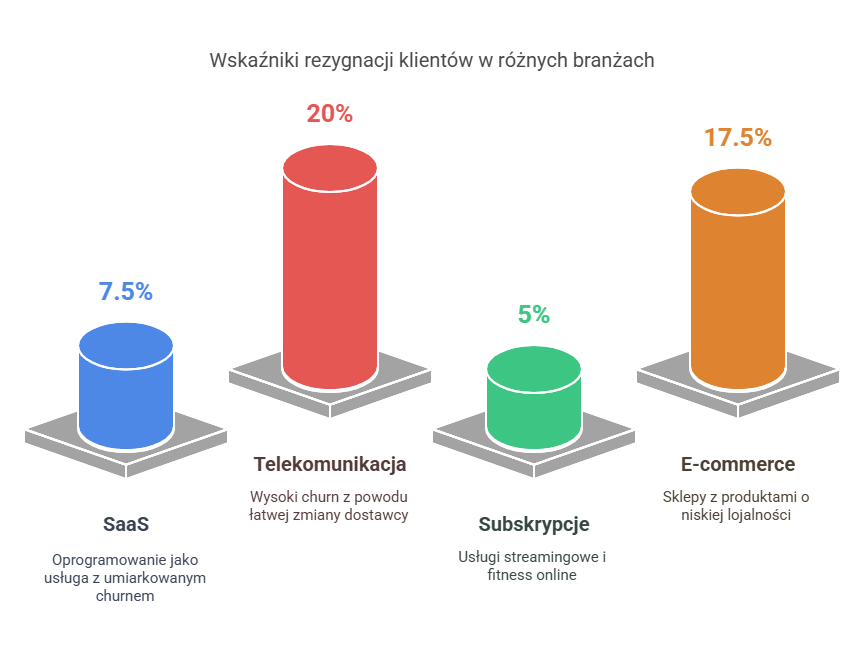
How many customers abandon a service or product in a given industry depends on many factors – competition, business model and how difficult it is to switch suppliers. There is no one-size-fits-all formula for churn rate, but some norms can be defined for different sectors:
- SaaS (software-as-a-service):– companies accept an annual churn rate of 5-10%. If the churn rate exceeds 10%, it’s a signal that something isn’t working – maybe onboarding is too weak or customers are missing value from the product,
- telecom – here the churn rate is sometimes higher, often exceeding 20% per year. The reason? Competition and ease of switching operators,
- subscriptions (streaming, online fitness) – monthly churn is usually in the 3-7% range. It is crucial to keep users engaged, because if someone doesn’t use for a month, they are likely to quit the next month,
- e-commerce – churn rate can be as high as 15-20% per month, especially in stores with products with low loyalty (e.g., clothing, electronics). Customers often buy once and come back only when they hit a good promotion.
B2B vs. B2C – why the differences are so big?
Churn rate and customer retention look very different in B2B and B2C, because the two models are governed by different rules. B2B tends to have lower churn – less than 5% per year. Companies don’t change suppliers overnight, and decision-making processes are longer and more complicated. In B2C, churn is higher because users make decisions faster, often impulsively.
How to reduce churn rate in B2B? Bet on personalization and dedicated customer service. Good strategies for reducing churn rate include loyalty programs for key customers and regular check-ins with business account managers. And what works in B2C? This is where quick response counts. If a customer starts using a service less, it’s worth reminding him or her of its value – via email, in-app push or exclusive promotion. The idea is to keep him before he actually quits.
Tracking industry benchmarks allows you to assess whether a company’s churn rate is within the norm or needs urgent intervention. The most important thing is not just to measure departing customers, but to understand why they do it – and act on it in advance.
What level of churn rate is considered acceptable?
It depends on the industry. In some sectors, such as SaaS or B2B, a churn rate of less than 5% per year is a good result. In others, such as e-commerce or telecommunications, where competition is high and customers frequently switch suppliers, a churn rate of 15-20% per year is not unusual. The most important thing is to regularly monitor this rate and respond to the decline in customer retention.
Why do customers churn?”
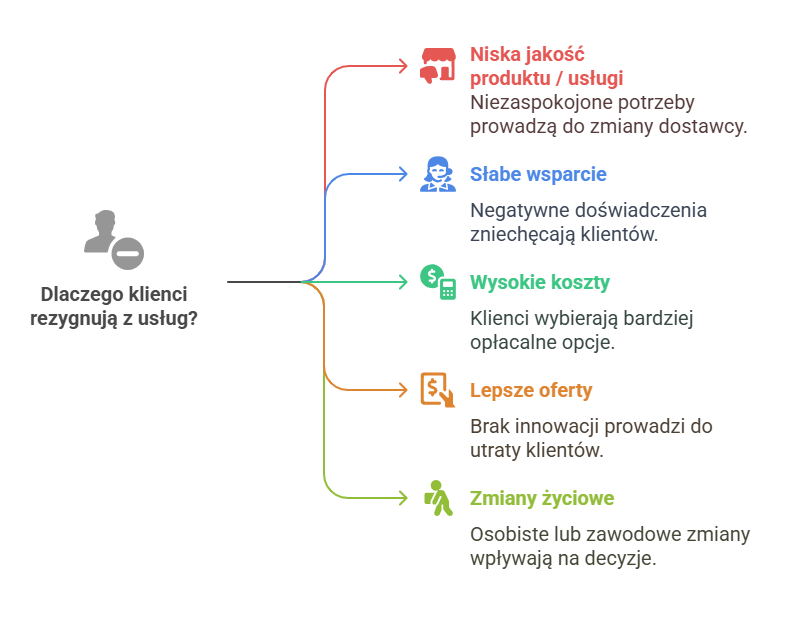
Customers choose to churn for a variety of reasons, which is directly reflected in the churn rate. The main reasons are:
- low satisfaction with the quality of the product or service – consumers’ expectations are high, and failure to meet their needs leads them to switch providers,
- poor support from the company:- lengthy response to requests, unresponsiveness to problems or poor quality of service effectively discourage customers – 89% of people switch suppliers after a negative experience,
- high costs – consumers compare prices and choose more cost-effective alternatives, especially for B2B companies, where price must go hand in hand with added value,
- more attractive offers from other companies – a lack of innovation, modern solutions or loyalty programs leads customers to look for better options,
- changes in customers’ personal or professional lives – such as. a move or a change of preference in the telecommunications industry.
To reduce the churn rate, you need to monitor warning signs, such as a drop in service frequency or numerous complaints. Introducing flexible payment methods, attractive loyalty programs and regular customer satisfaction surveys can significantly increase retention.
Chaurn rate rising? Warning Indicators
What can indicate that the risk of churn rate is increasing? The most important warning signs are:
- decrease in engagement – less frequent use of services, reduced interaction with the brand or lack of response to communications,
- negative feedback and complaints – expressing dissatisfaction with the quality of the product, service or added value,
- changes in buying behavior – reducing the frequency of orders or switching to cheaper options,
- lack of response to new offers – ignoring promotions, loyalty programs or new proposals.
Early detection of these symptoms allows preventive measures to be taken, such as personalized offers, improved service quality or flexible payment terms. In this way, the company effectively minimizes the risk of losing customers and reduces the churn rate.
How to effectively reduce the churn rate?
To reduce customer churn, you need to act on several fronts. It’s important not only to understand why customers churn, but also to make specific changes that will retain them. What can help?
Improving the quality of your product or service
Customers leave if something doesn’t meet their expectations. Regular updates, fixing bugs and listening to customer feedback are key. As many as 67% of users quit because they are not satisfied with what they are getting (https://surveysparrow.com/blog/customer-satisfaction-stats)
Loyalty programs that actually give something
Rebates, points, exclusive offers – if customers feel they are getting value for their loyalty, they are less likely to leave. Good examples? Streaming subscriptions that reward referrals to friends.
Personalized communications instead of mass spam
No one likes generic emails. CRM allows you to customize your communications – payment reminders, offers tailored to customer behavior, and even a simple „thank you for being with us” can make all the difference.
Monitoring warning signs
If a customer is using a service less frequently, reporting more problems, or ignoring offers, it’s a sign that they may soon leave. It’s worth responding in time – such as with a special offer or a conversation with a consultant.
Higher customer service
89% of customers switch providers after a bad service experience (https://www.wavetec.com/blog/customer-service-statistics/). Quick response, help instead of complicated forms and availability of support on different channels (phone, chat, email) is what makes the difference.
Flexible payments instead of hard rules
Some customers leave not because they don’t want to use, but because they have temporary financial problems. The option of installment payments, subscription breaks or seasonal discounts can reduce the churn rate.
Data analysis and preemptive action
Customer segmentation allows you to see who is most likely to leave. This allows you to act proactively – for example, by informing about new products or sending special offers before the end of a contract.
How to measure the effectiveness of churn rate reduction activities?
To assess whether you have been successful in reducing customer churn, you need to compare results before and after implementing changes. It’s worth monitoring the churn rate regularly – every month, quarter or year – to see if the strategy is working. Numbers alone, however, are not enough. Other metrics are also important to show how customer retention is affecting business. What to look for?
- Loss of Revenue (MRR Churn Rate) – shows how much a company loses through departing customers.
- Customer Lifetime Value (LTV) – helps assess how long a user stays and how much they realistically bring to the company.
- Customer engagement – if they are actively using the service, opening emails and testing new features, it’s a good sign.
It’s also worth asking customers directly what they like and don’t like. This can be done through:
- short surveys,
- 1:1 conversations,
- analysis of social media feedback.
Additionally, CRM and behavioral analysis help catch which users are losing interest. This allows you to act earlier, before they actually leave.
It’s also good to segment customers into groups, such as new customers and those who have been with the company for years. Cohort segmentation will show you what actions work best in different cases. If you regularly analyze the results, you can adjust your strategy and optimize retention processes on an ongoing basis. The result? Less losses, more loyal customers and more stable revenues.
Summary
Understanding churn rate is important in the context of better customer relationship management and business process optimization. By knowing why customers are lost, you will gain the tools to retain and engage them for longer.
Was the article helpful?
Rate our article, it means a lot to us!
Let's talk!

CEO and managing partner at Up&More. He is responsible for the development of the agency and coordinates the work of the SEM/SEO and paid social departments. He oversees the introduction of new products and advertising tools in the company and the automation of processes.